Reports
Branded, paged, print-ready reports built from your data sheets, exportable to PDF and shareable as a link.
On this page
A Report is a branded, paged, print-ready document built from your data sheets and designed to be run again and again.
Where to find it
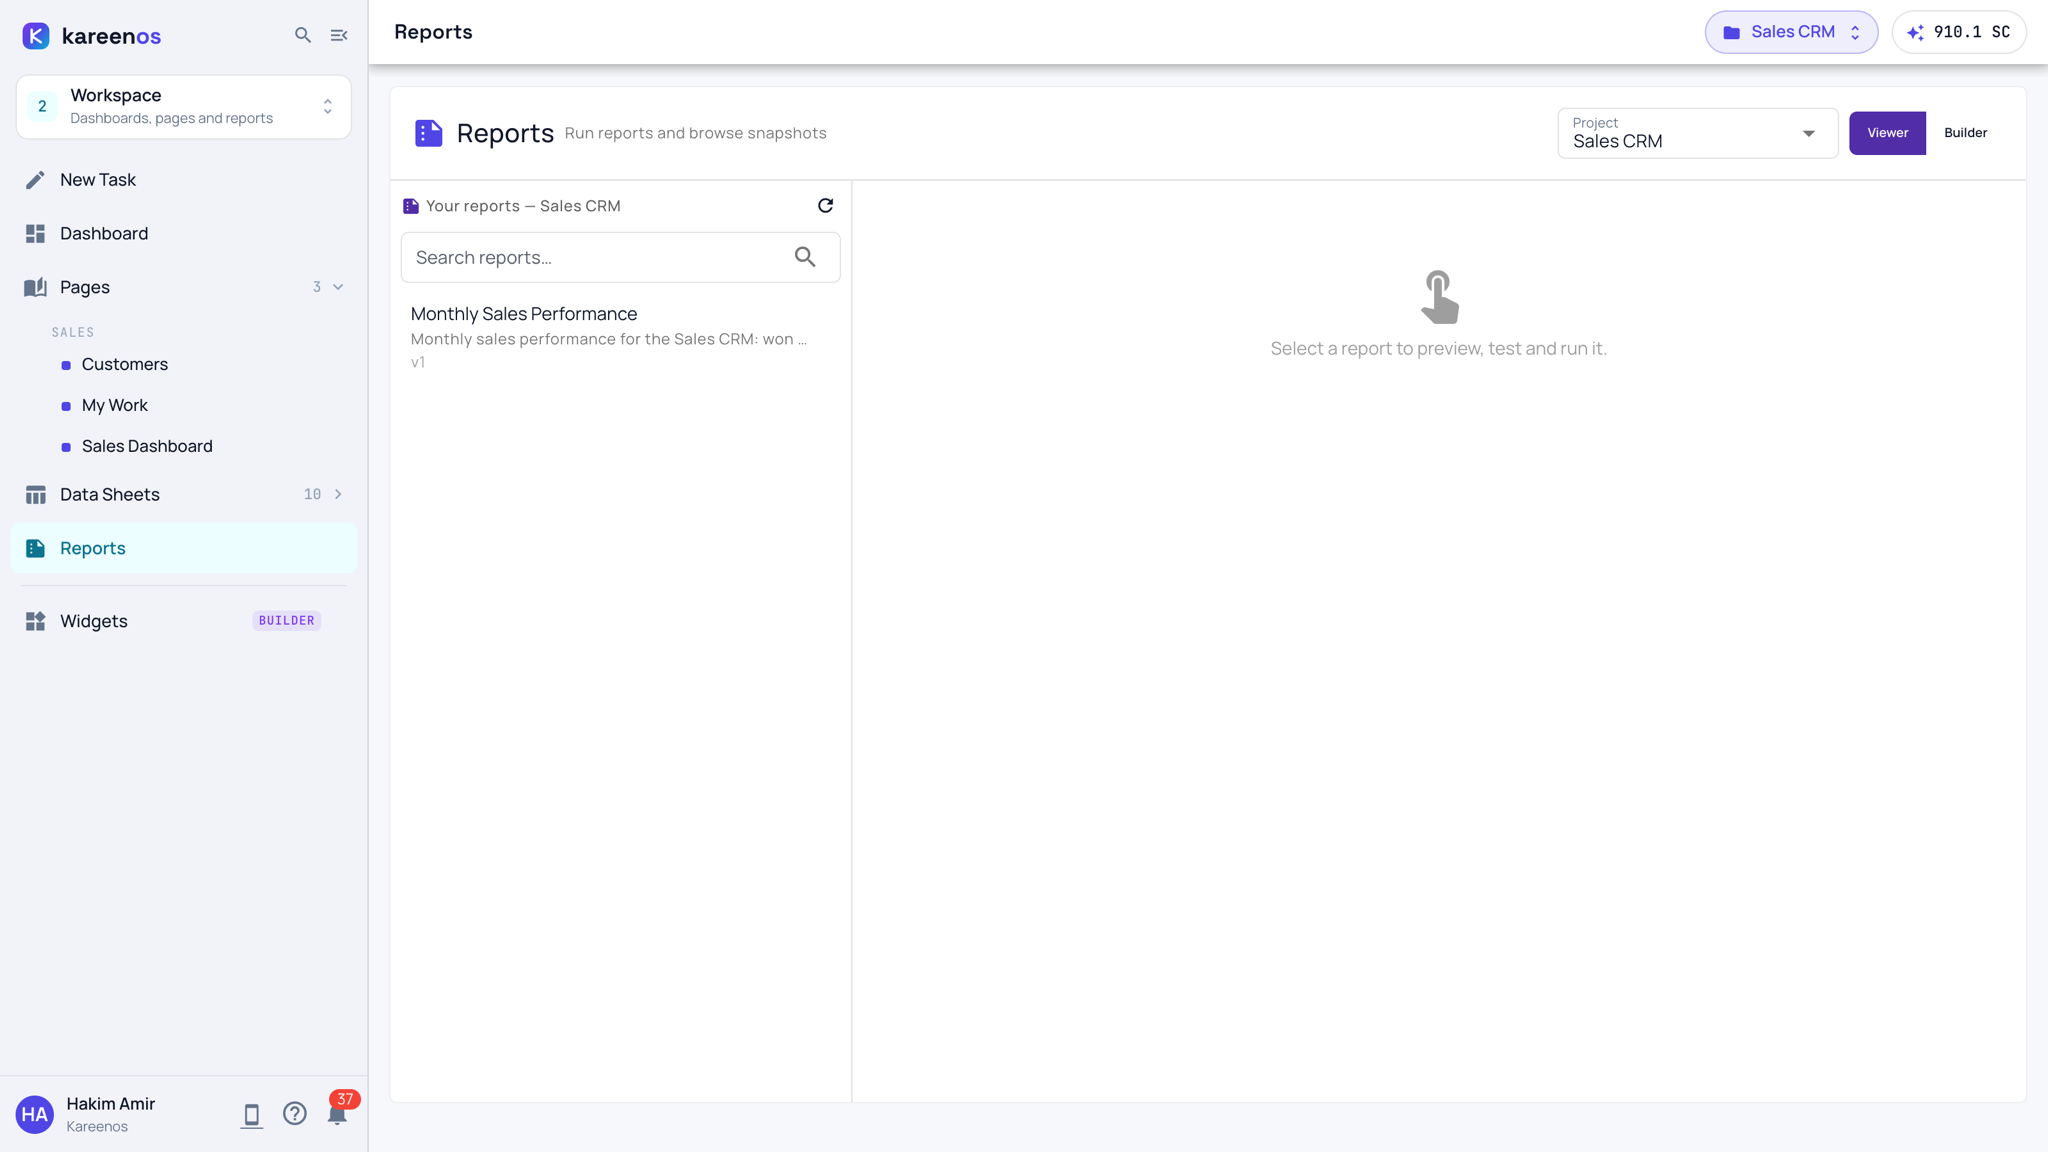
Reports is a row of level 2 (Workspace). Press Open in Kareenos above. The page has its own Project picker at the top right, beside the Viewer and Builder switch: check it shows the project you want. Anyone granted the project can run a report; Builder is for builders.
What makes a Report different
A Report is query-driven. You run it with filters (a date range, a branch, a customer) and it pulls the current figures out of your Data Sheets, lays them out over numbered pages with your branding, and produces something you can hand to a client or a board.
A Document is free text an agent wrote once. A Report is repeatable: same definition, new numbers, every time you run it.
Snapshots, PDF and sharing
Each run is frozen as a snapshot, so a figure you quoted last month still reads the same when someone opens it again. Alongside that:
- Export any run to PDF.
- Share a public link, which always shows the latest run rather than a fixed copy.
- Have a scheduled automation run a report and email it out.
Step by step: running, freezing and sharing a report
- Open Reports and choose the Project at the top right.
- Click the report in the list on the left. Its preview opens on the right with the filters it asks for.
- Set the filters and run it. The paged output renders live from the current data.
- Open Report Runs from the report to see every run. A run marked live re-renders from stored data; press Freeze snapshot to fix it as a printable, unchanging copy.
- Press Share run to copy the public link, or export the run to PDF.
- Ask in New Task to schedule the report if it should arrive by email on a cycle.
Note
Because runs are frozen, re-running with the same filters after your data changed produces a new snapshot with different numbers. Both remain available.
Common mistakes
- Editing a report's figures by hand. Correct the underlying rows and run it again.
- Sharing a PDF when you wanted the recipient to see the latest figures, or sharing a live link when you wanted the numbers pinned.
- Using a report where a dashboard tile would do. Reports are for printed, paged output.