Reports
Branded, paged, print-ready reports built from your workbook data, exportable to PDF and shareable as a link.
On this page
A Report is a branded, paged, print-ready document built from your workbook data and designed to be run again and again.
Where to find it
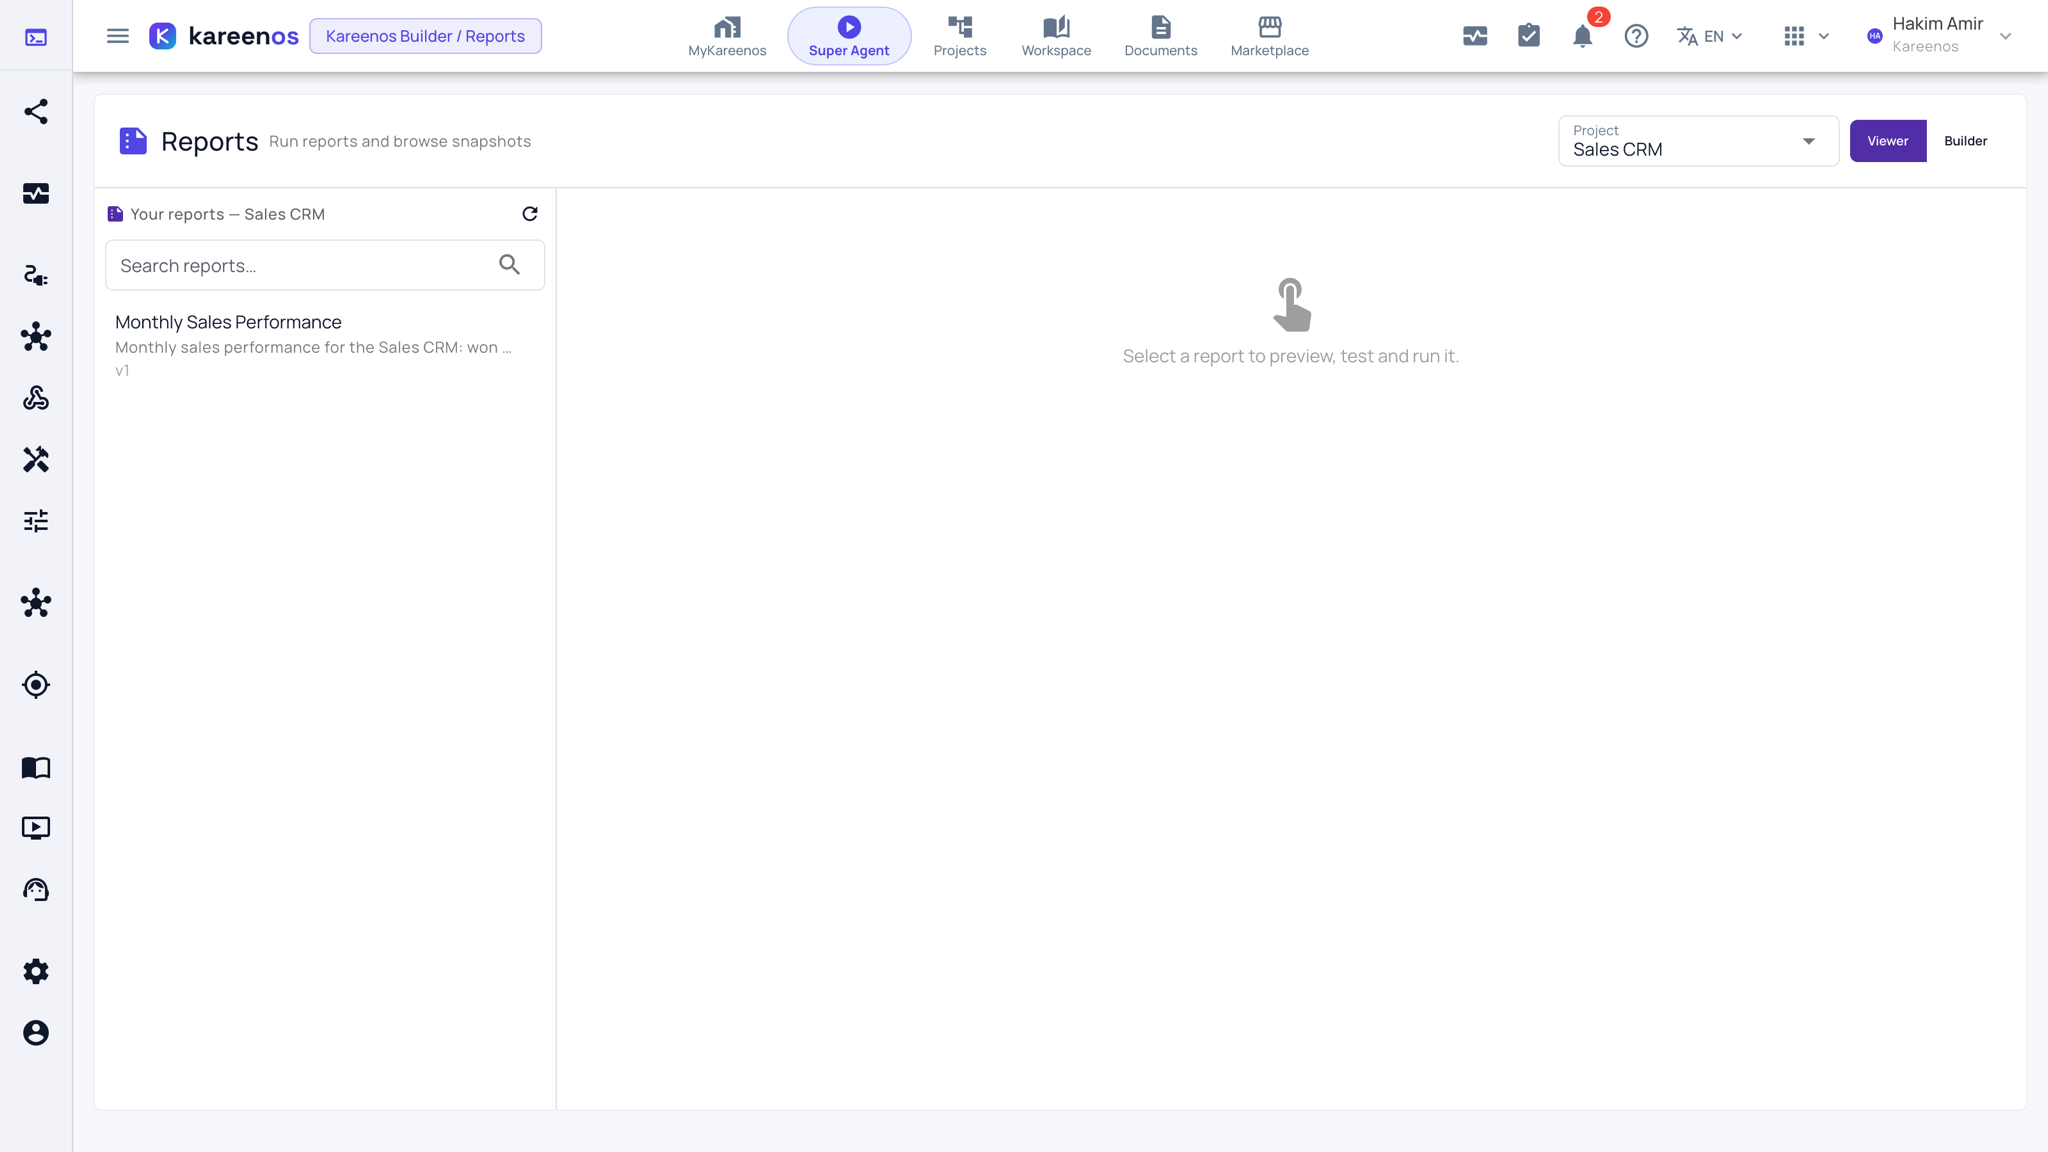
Press Open in Kareenos above to open the Reports page, or open the left menu and choose Editors, Reports. Members also find Reports as a fixed entry near the bottom of the Workspace drawer. Anyone granted the project can run a report; the Builder toggle at the top right is for builders.
What makes a Report different
A Report is query-driven. You run it with filters (a date range, a branch, a customer) and it pulls the current figures out of your Live Workbooks, lays them out over numbered pages with your branding, and produces something you can hand to a client or a board.
A Document is free text an agent wrote once. A Report is repeatable: same definition, new numbers, every time you run it.
Snapshots, PDF and sharing
Each run is frozen as a snapshot, so a figure you quoted last month still reads the same when someone opens it again. Alongside that:
- Export any run to PDF.
- Share a public link, which always shows the latest run rather than a fixed copy.
- Have a scheduled Job run a report and email it out automatically.
Step by step: running, freezing and sharing a report
Open Reports and choose the Project at the top.
Click the report in the list on the left. Its preview opens on the right with the filters it asks for.
Set the filters and run it. The paged output renders live from the current data.
Open Report Runs (the runs page opens from the report) to see every run. A run marked live re-renders from stored data; press Freeze snapshot to fix it as a printable, unchanging copy.
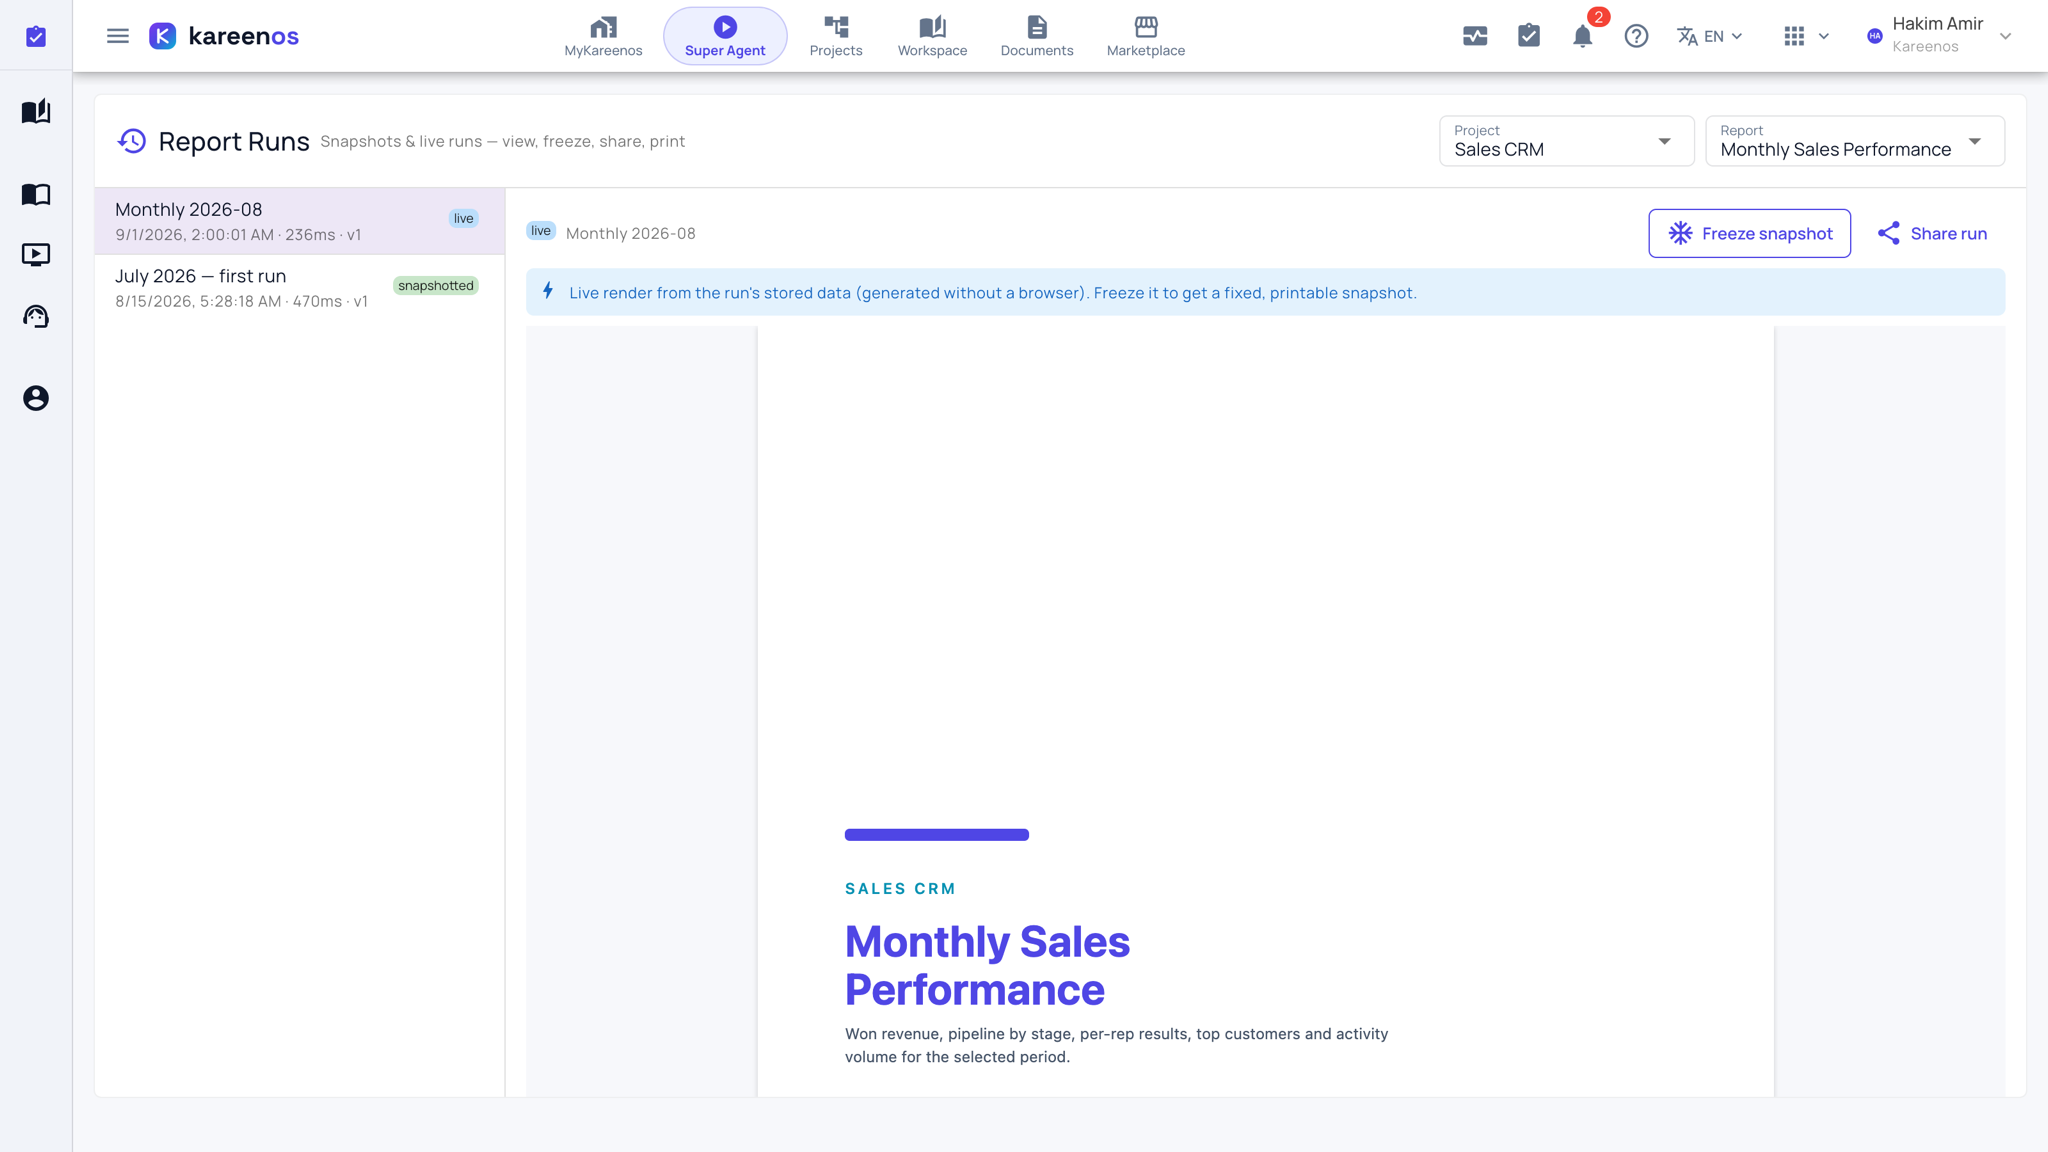
Press Share run to copy the public link, or export the run to PDF.
Ask the Super Agent to schedule the report if it should arrive by email on a cycle.
Note
Because runs are frozen, re-running with the same filters after your data changed will produce a new snapshot with different numbers. Both remain available.
Common mistakes
- Editing a report's figures by hand. Correct the underlying rows and run it again.
- Sharing a PDF when you wanted the recipient to see the latest figures, or sharing a live link when you wanted the numbers pinned.
- Using a report where a dashboard tile would do. Reports are for printed, paged output.